| |
Volume 10, May 2019
Intonation in the Performance of the Double Bass: The Role of Vision and Tact in Undershoot and Overshoot Patterns
by Fausto Borém and Guilherme Menezes Lage
3. Method
1. Participants
Seven professional double bassists (mean of 9.6 ± 2.5 years of professional practice) with no prior experience with the procedures, volunteered to take part in the experiment, which was carried out according to the ethical guidelines laid down by the local Ethical Research Committee.
2. Recording apparatus
A very common size double bass (3/4 type; string length of 106 cm) was used in the experiment. Audio signals were detected with a pick up (Fishman BP-100) attached with a clamp to the bridge of the musical instrument. The signals were amplified by a mixer (Staner 04-2S) and connected to the line input of a computer sound card, being sampled at 22.050 samples per second, 16 bits per sample.
3. Tasks
A sequence of spatialized target notes (Figure 3) having no intended musical meaning and encompassing all four registers of the double bass (C4 being the C in the middle of the piano keyboard) was played in two conditions by the participants. This sequence of 16 notes was designed to have a scattered non-melodic atonal nature in order to make it practically impossible to be memorized at first sight, or even after a few repetitions. The equal-tempered scale was chosen because it is the most common scale used in music teaching (sight singing, ear training, melodic and harmonic dictation, etc.) and therefore the one the great majority of modern musicians are used to. In all sensorial conditions of the trials, pauses ranging from 1.0-5.0 seconds between long notes with 0.5-1.5 seconds of duration were mandatory. The participants were asked not to adjust their left hands after the beginning of the attempted note. In the few instances where adjustments happened (less than 1%), the participant was asked to repeat the note. Adjustments were detected either by spectrographic analysis of the audio signals or directly by an assistant who visually monitored left hand gestures. To avoid intonation instabilities due to poor or variable bow control, the notes were played pizzicato. The double bass' strings were electronically tuned based on the orchestral A4 of 440 Hz. The double bass is a transposing instrument and its notes sound one octave lower than the written pitches; a C#4 (the second note of the atonal sequence), for example, produces a C#3.
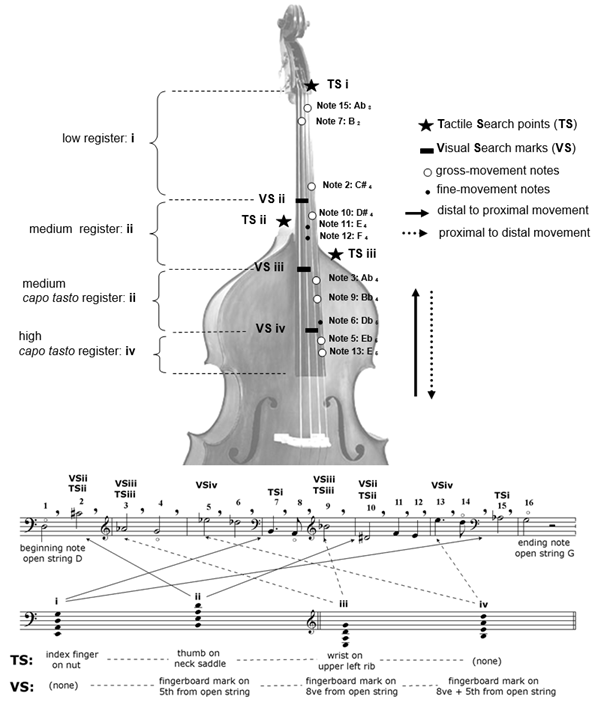 Figure 3 — The double bass with Tactile Search points (TS), Visual Search marks (VS), 11 target notes (notes 2, 3, 5, 6, 7, 9, 10, 11, 12, 13 and 15) of spatialized atonal sequence and corresponding music staff with target notes.
4. Procedures
The musical sequence was presented to the participants on a blackboard with staves located two meters in front of them. Each participant played the musical sequence two times with an interruption of 5 minutes between them, each trial having a different use of sensorial constraints. In order to prevent gliding between notes (that is, sliding the playing finger during the trajectory to the target note) and repeated bias throughout the sequence, the participants were instructed to take their hands off the double bass fingerboard after playing every note, as can be inferred by the commas between adjacent notes in the atonal sequence (see Figure 3 above).
In the trial based on visual and tactile orientation, the following location cues (see Figure 3 above) were given to the participants during the experiment: (1) three Tactile Search points (TS i, TS ii and TS iii) located in three different places of the instrument body (namely the nut touched by the index finger, the saddle nut touched by the thumb and left upper rib nut touched by the wrist, respectively; see Figure 3); and (2) three Visual Search marks (VS ii, VS iii and VS iv), namely white dots attached to the fingerboard, signaling the intervals of the perfect fifth, perfect octave and perfect thirteenth (one octave plus a perfect fifth) departing from the open strings, respectively (see Figure 3). The tactile and visual cues have a complementary role as the TSs covers the lower range (registers i and ii) and the VSs covers the higher ranges (registers ii, iii and iv), what yields an overlapping area in the middle register (see Figure 3 above). A research assistant monitored every trial to guarantee that the participants respected the previous orientations and sensorial constraints.
The trials were performed as follows. Having been introduced to the sequence of notes, written on a music blackboard in front of the player, the participant performed two trials on the double bass: (1) the Free Trial (performance based on the musician's previous experience, without instructions on TS or VS), which served as a control trial and (2) the Integrated Trial (performance based on the integration of tactile and visual guidance, that is, TS and VS).
The rationale for the no-random order of the trials was intentionally based on the following aspects: (1) the Free Trial was the first to be performed in order to allow the participant to use his/her own intonation strategies and (2) the Integrated Trial was performed after the Free Trial to avoid conscious simultaneous use of sensorial cues. The learning effect is not to be found in this sequence due to its atonal, spatialized and fragmented nature, what, as mentioned before, makes it very difficult to be memorized even after several trials (Lage at al, 2007).
From the 16 notes of each trial (Free Trial and Integrated Trial), 5 notes were to be performed with open strings (that is, no use of the left hand) and therefore to be discarded, remaining 11 notes for the analysis. The recorded sequences were analyzed as described in the next section.
5. Analyses of audio recordings
The audio files were processed by custom-made software implementing the so-called Super Resolution Algorithm (Medan, Yair, & Chazan, 1991). This fundamental frequency (F0) tracker based on the cross-correlation function was designed for speech analysis but was found to be robust and precise for the analysis of double bass audio signals. To avoid gross errors that may occur in F0 extraction methods, where the algorithm may track half or twice values of fundamental frequencies, search intervals were limited to ±25% (approximately the interval of a major third) around the correct frequency of each note. The correct frequency ( f ) of a note distant n semitones from the base frequency (440 Hz) was computed as  , where , where  is the constant for equal-temperament, and n > 0 for f > 440 Hz (and vice-versa). is the constant for equal-temperament, and n > 0 for f > 440 Hz (and vice-versa).
The estimated frequency of each note was the average value over the respective duration. In order to check the measurements, automatically determined frequencies were compared with approximate values manually extracted from narrow-band spectrograms. In a few cases, where the performed note was outside the ±25% search range, the automatic detection was repeated around the value manually read from the spectrogram. A total of 154 values (7 participants ´ 2 trials ´ 11 notes) were then analyzed. In order to compare the measured frequency ( ) with the respective theoretical value ( f ), the magnitude of the relative error, ) with the respective theoretical value ( f ), the magnitude of the relative error, , was computed for each of the 154 notes. Statistical analyses were carried out, as detailed below. , was computed for each of the 154 notes. Statistical analyses were carried out, as detailed below.
For each of the seven participants, error values were organized into 2 blocks, one per trial, each block having 11 valid notes, from which the absolute mean error, its respective standard deviation and constant error were initially calculated. Next, individual errors beyond two standard deviations from the respective block mean were discarded as outliers. This filtering process removed less than 1% of the data. Finally, the absolute relative error (RE), RE standard deviation (SDRE) and the signed relative error (SRE) were computed for each trial over the seven participants. The RE values provide information about the performance accuracy, the SDRE values are related to response consistency and the SRE values, which are the main point of this study, provide information about error direction (undershoot or overshoot patterns). The SRE was analyzed as follows: (1) eleven notes, regardless of movement direction, (2) six notes, performed in descending movements and (3) five notes, performed in ascending movements, respectively.
It should be noticed that a RE of 6% roughly equates the interval of a semitone, and the just noticeable changes in frequency is approximately 0.7% (Zwicker & Fastl, 1990). The non-parametric Wilcoxon Test was used to compare the means between trials (Free and Integrated Trials) in three dependent measurements. A significant level of 0.05 was adopted.
|
|